Cologne Air Quality Improvement

Problem
By analyzing NO₂ pollution levels in Cologne, we found sites near sources of high vehicle exhaust correlated with significantly increased pollution, highlighting the need for action.
Solution
By visualizing data comparing urban and rural sites, we presented our research on a public-access website, making our findings more accessible and usable. To that end, we also created a picture book educating children and their parents on the value of green spaces and the impacts of poor air quality.
Takeaway
This project gave me technical experience analyzing data and translating research findings into approachable formats, relying on visualization and organization to reach a wider audience.
Problem

This project was part of a course on environmental engineering I took while studying abroad in Berlin. The focus of the study abroad was on environmental engineering, and featured many field trips to state of the art companies and discussions with local experts on a wide range of environmental engineering focuses. This project was focused on analyzing poor air quality in German cities as a way to learn about different software applications that assist in data processing and visualization. My team and I decided to study the air quality around Cologne. We looked at a variety of factors for why different pollutants increased in concentration around specific urban centers and developed a number of hypotheses for what could be causing these specific pollutant concentrations and why they were found in these specific areas. Then, to address these sources of pollution, we compared our data to a nearby green space to support our final proposal of increasing green space urban areas of Cologne.
One key part of our project was thinking about how to present our research findings in an appropriate manner for our target users. Initially, our research team planned to address public and environmental health officials in catering a directive for improvement in Cologne. However, through iterative research and through presentation to our cohort of engineering students, we gleaned an interesting perspective shift. With the realization that political change is often slowed due to bureaucratic procedures, and changes are often incremental, we decided to focus concerted efforts on a public education campaign rollout, catering to younger and older audiences alike.
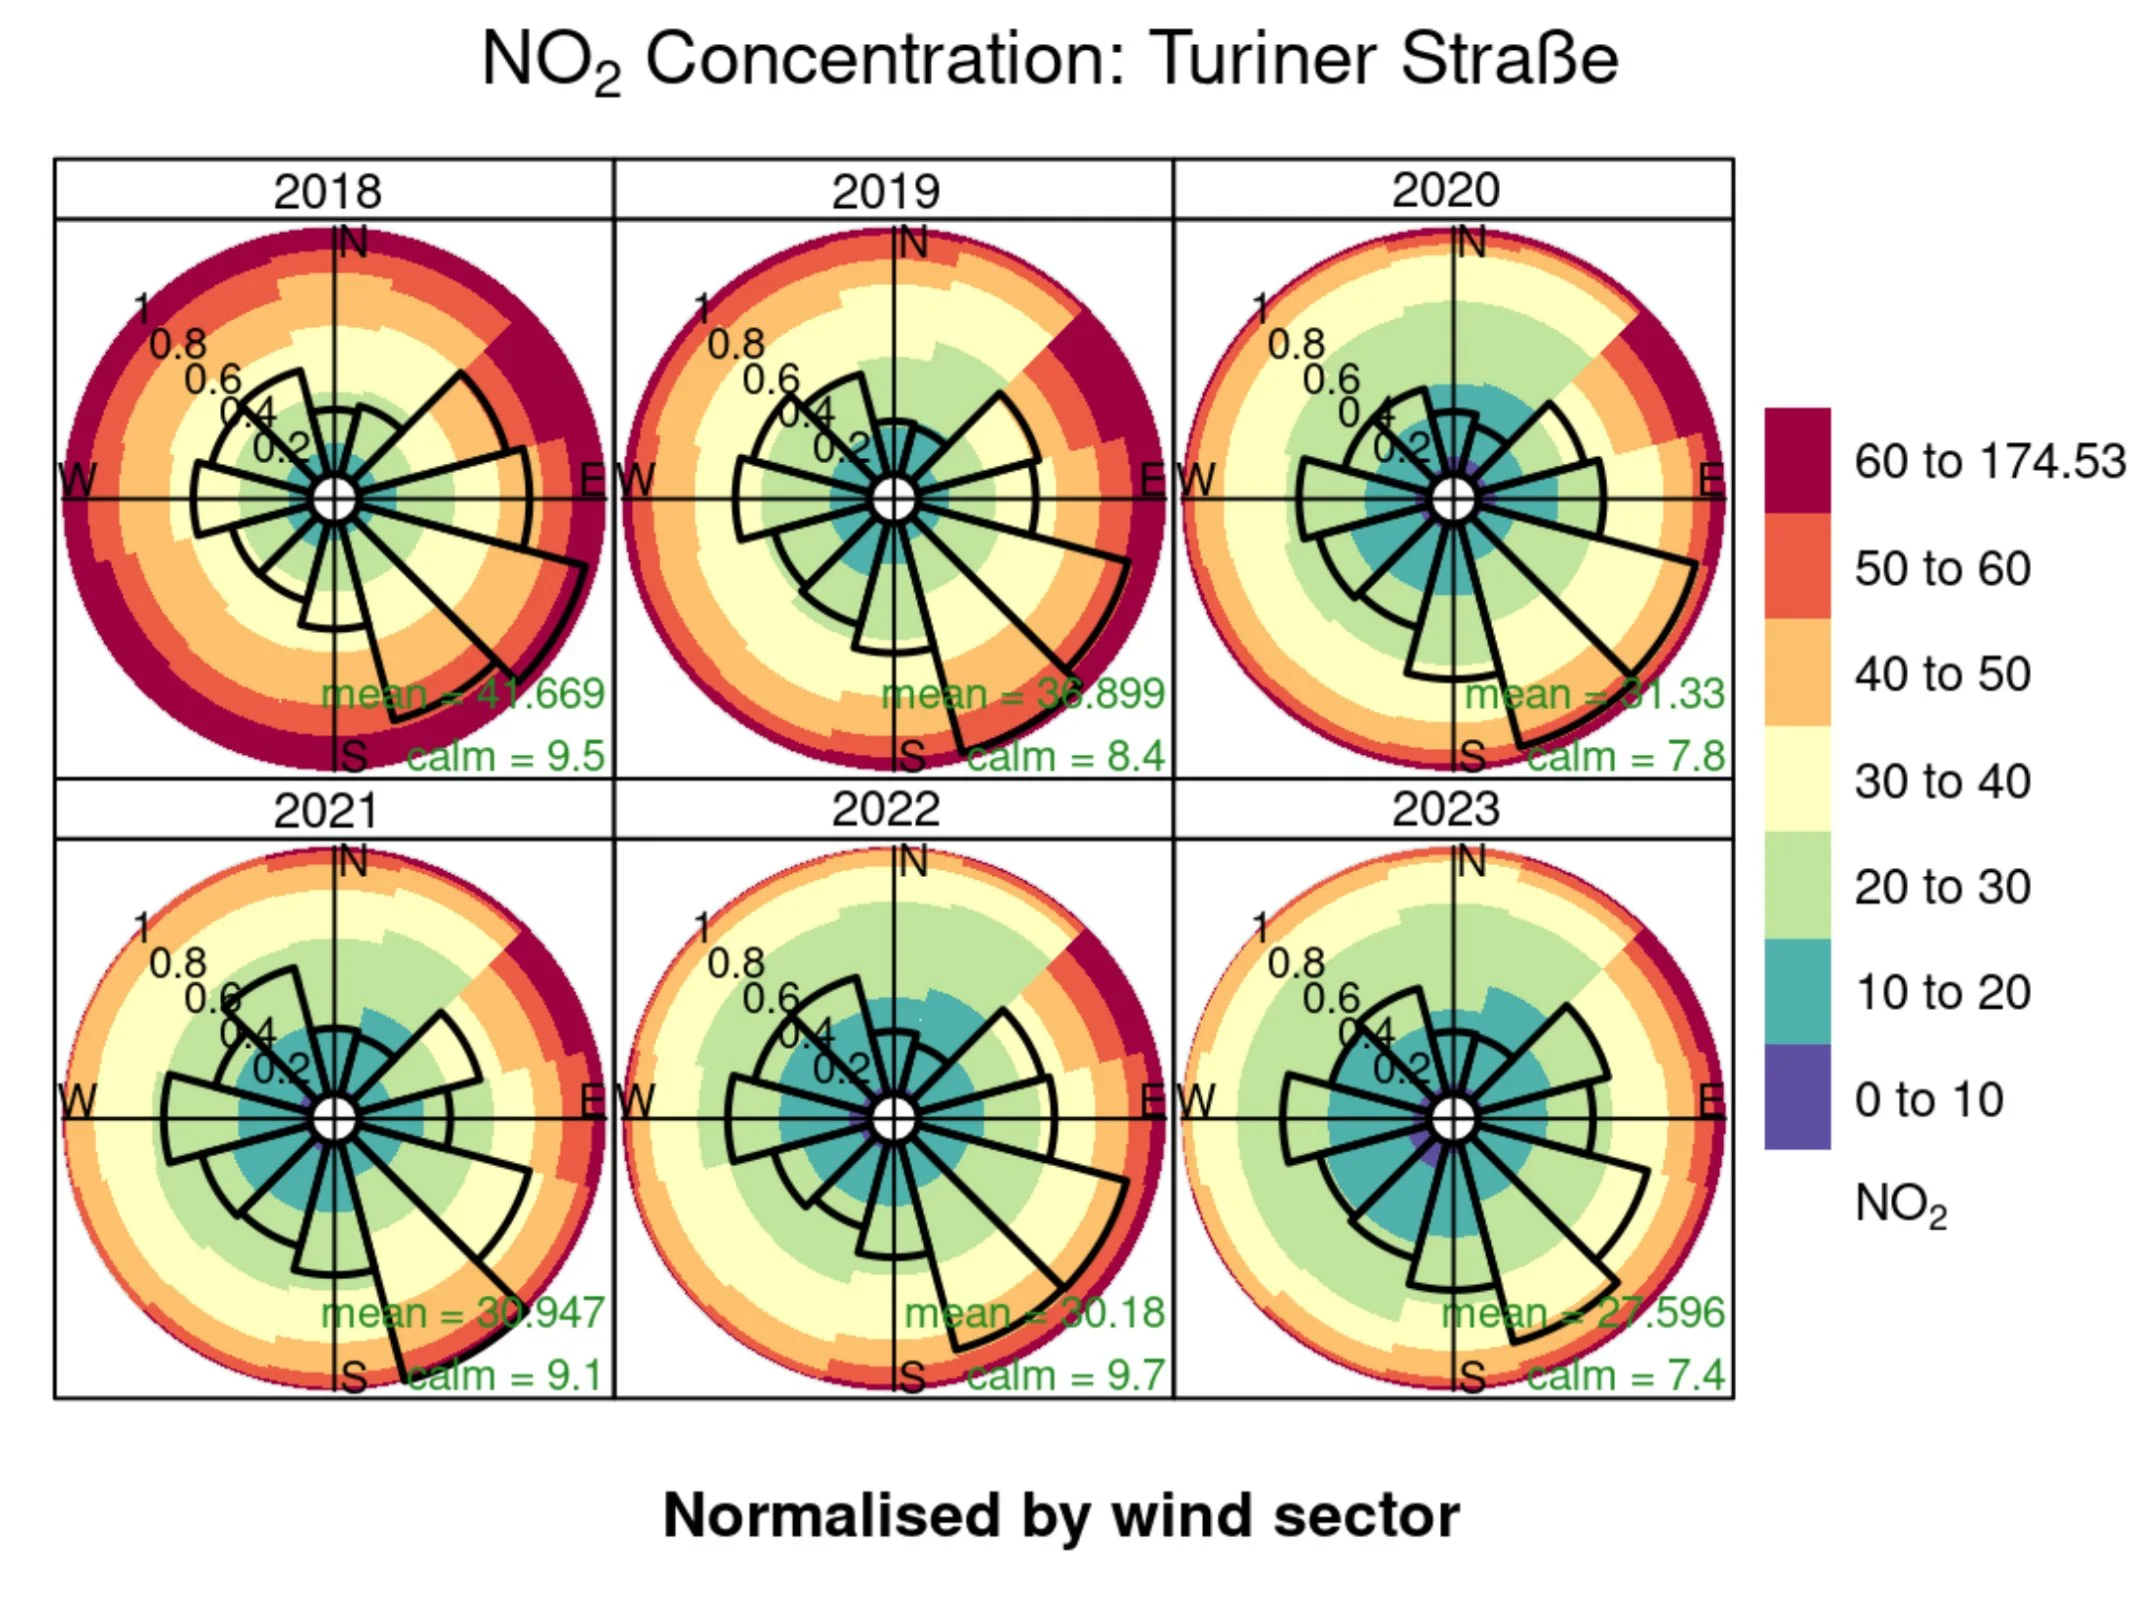
Research Question: Our guiding line of inquiry when conducting our air quality research was: “What is the impact of green space on ambient NO2 concentration in downtown Köln?” To investigate this, we compared data recorded at Rodenkirchen, nearby the community green space, park and garden at Finkens Garten, with Turiner Straße, a heavily trafficked urban intersection and street.
Methods: To evaluate and compare the air quality recorded at each site, we looked at a subset of data recorded over a six year time span from 2018 to 2023, and focused on plotting NO2 concentrations. To compare the data from these two cites, we utilized pollution roses, wind roses, time variant plots, box plots, and bar graphs. We compared data trends to evaluate different factors that could contribute to higher levels of NO2 across the sites, and developed a strategy of analysis to best categorize extraneous, regional factors and highlight local characteristics.
Software Used: When developing our plots, we utilized the Posit Cloud software with the OpenAir Library, employing the R-programming language. We also used Google Sheets to plot data for clearer visualization.
Solution
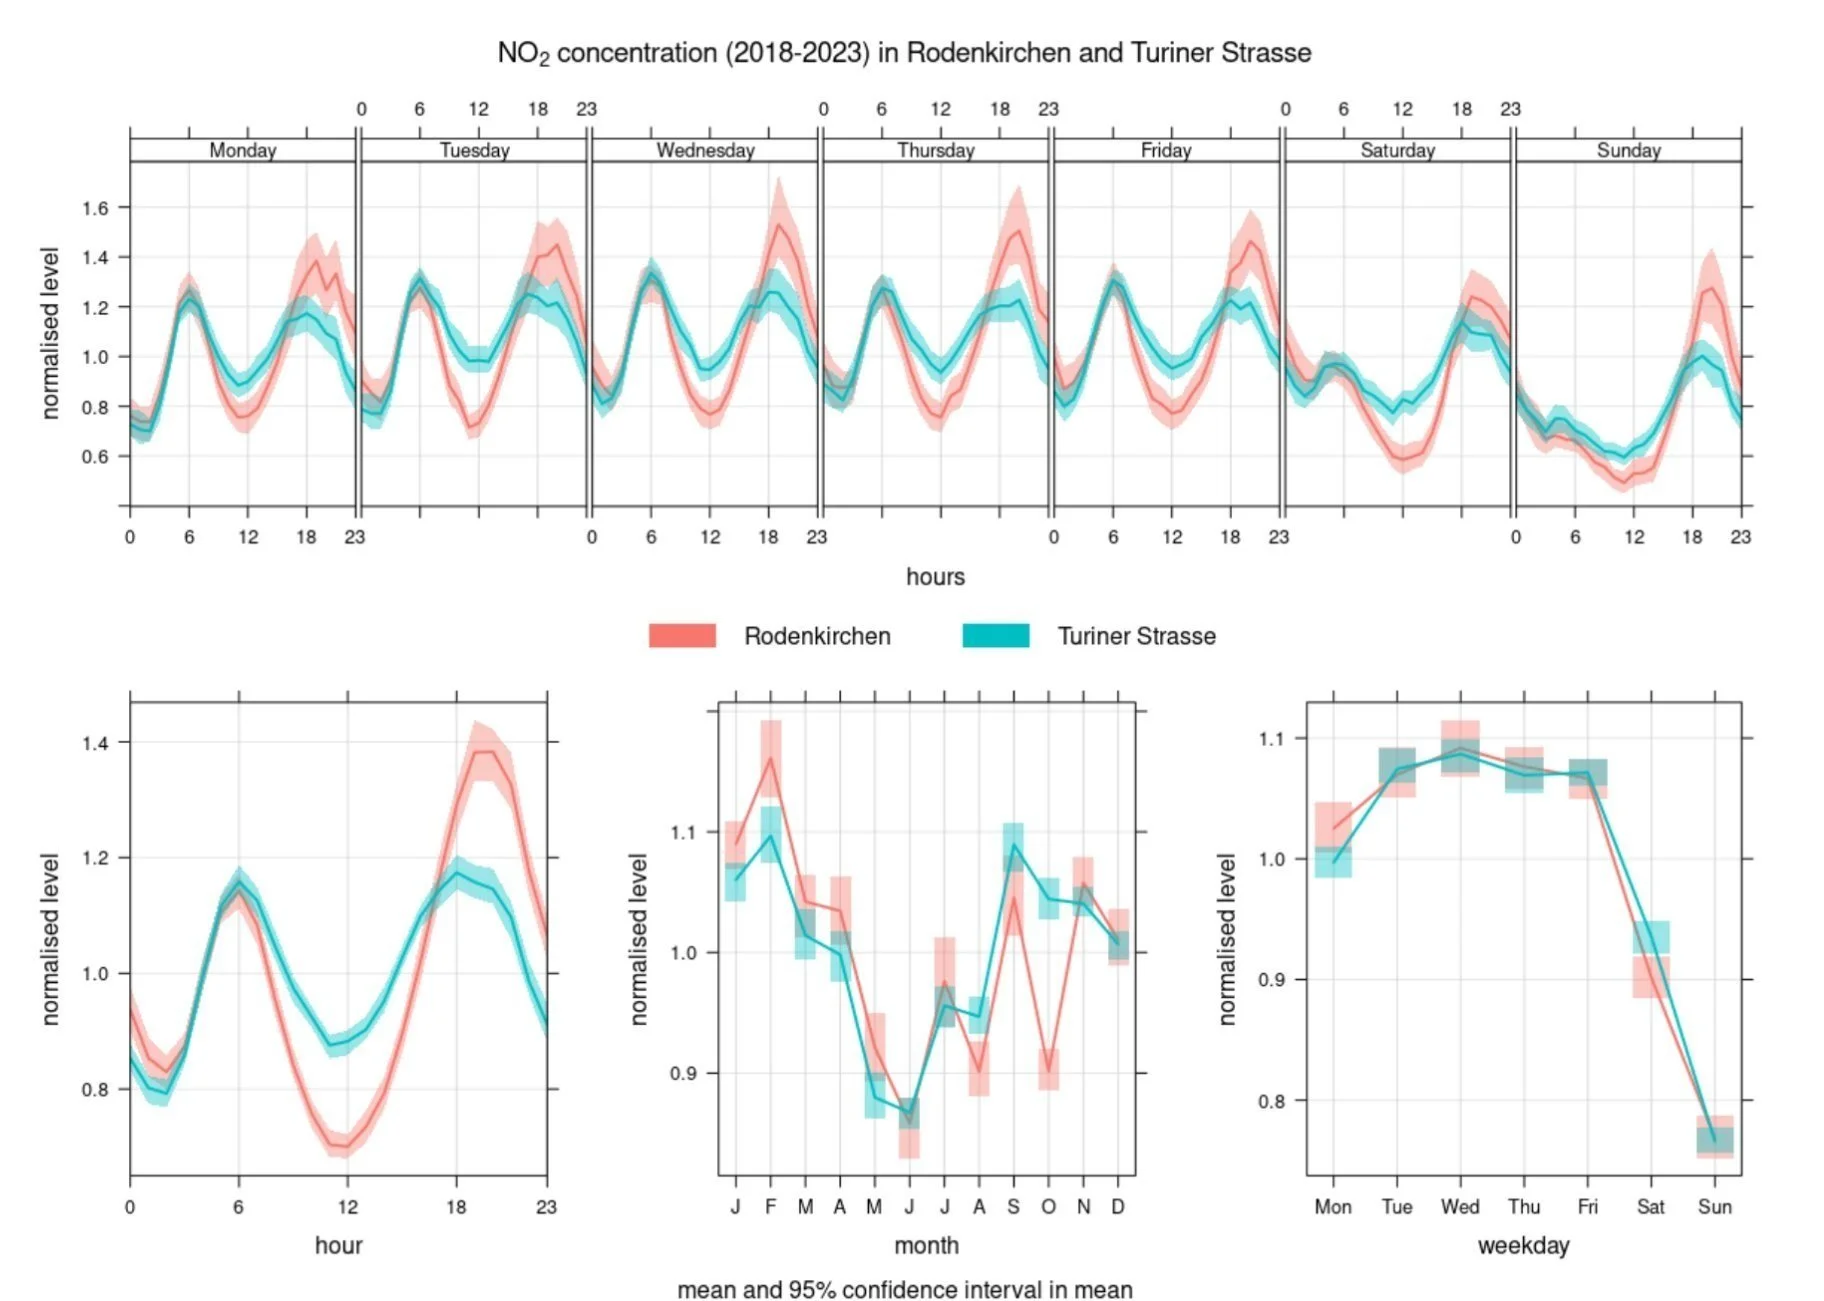
Our main findings can be summarized by the Time Variant Plot of NO₂ concentration measured at both sites. The vertical axis is an averaged measure of NO₂ concentration, and the horizontal axis is the respective time intervals. The top plot is NO₂ concentration measured hourly over the course of a week. The bottom from left to right is as follows: an hourly basis over the course of an averaged day, a monthly basis over the course of the six years averaged together, and a daily basis over the course of a week. Data is averaged across all six years from 2018 to 2023. As noted, red is the data for Rodenkirchen, while blue is the data for Turiner Straße. In general, this plot shows in several instances that NO₂ levels rise and fall in accordance with peak commute times, falling drastically over the weekends. Additionally, while Rodenkirchen has a higher afternoon peak than Turiner Straße (at 6:00pm), it also has a much lower minimum at 12:00 pm noon.
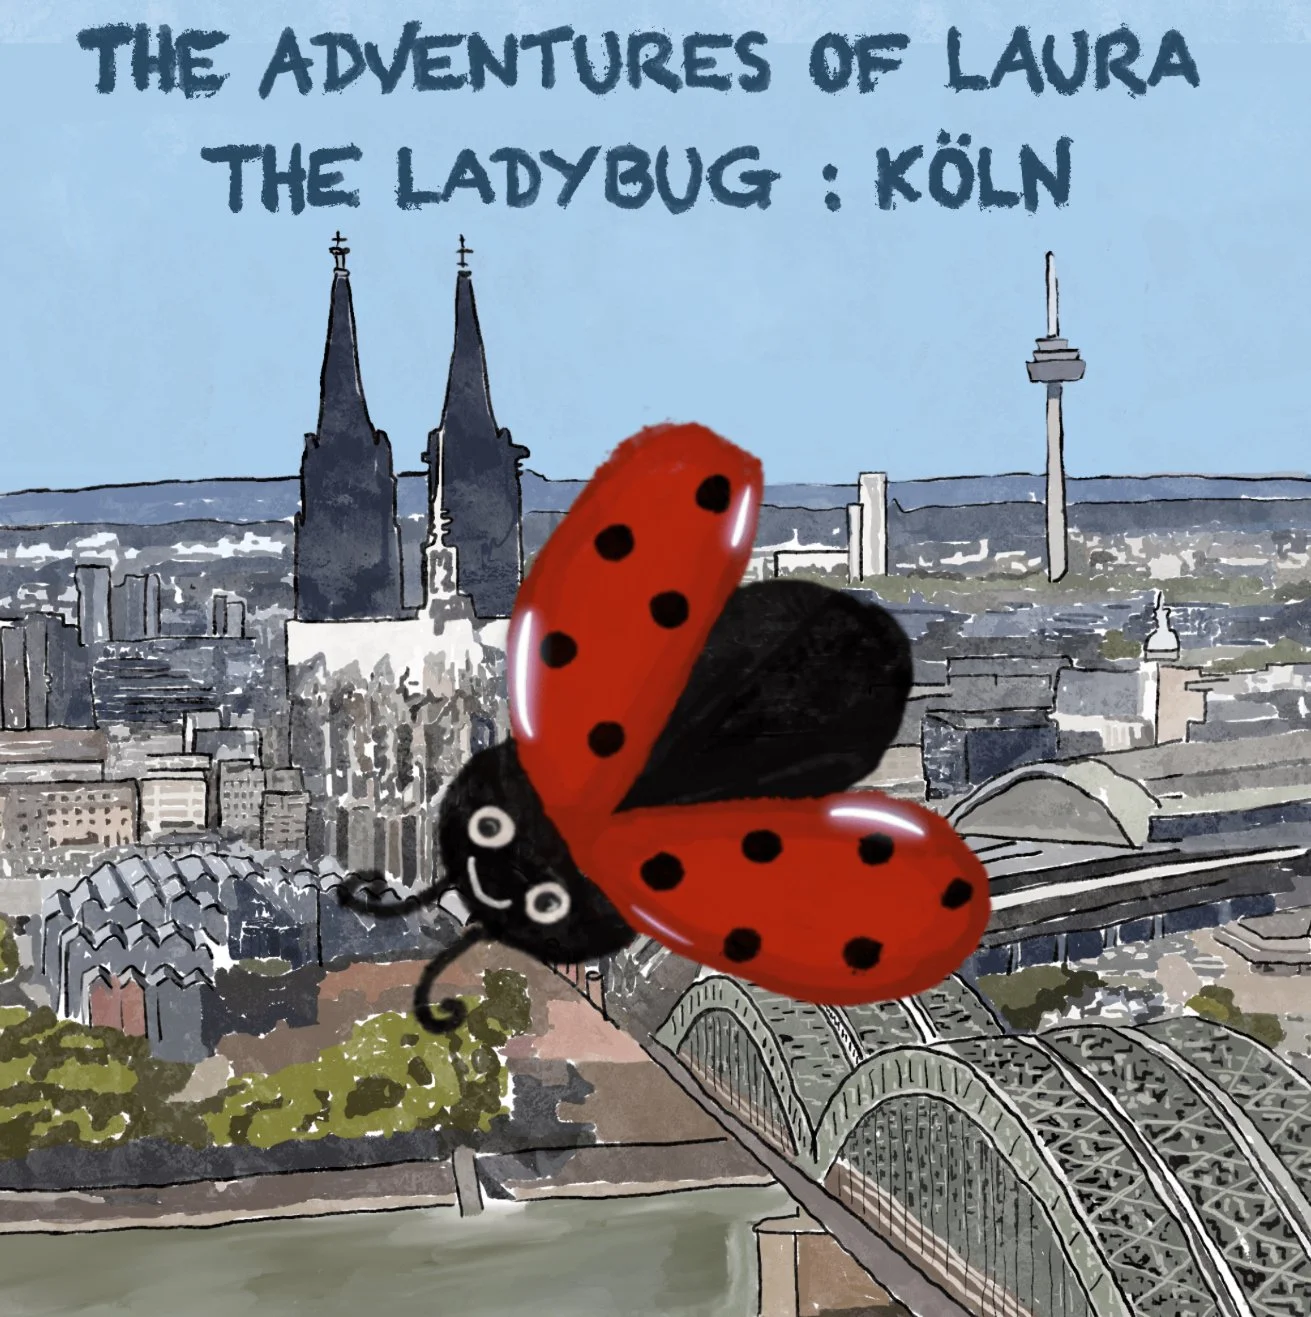
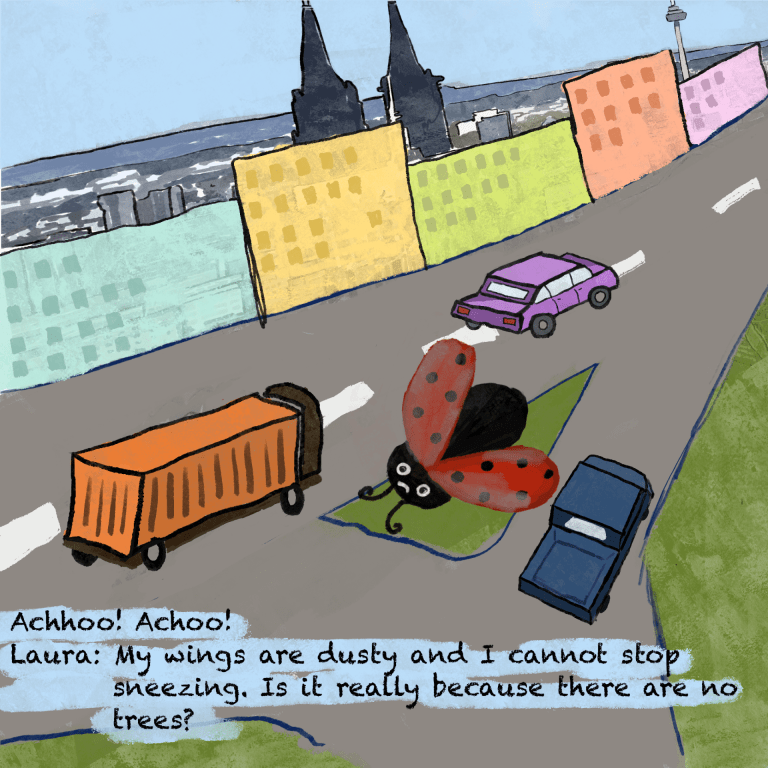
For younger audiences, we authored and illustrated a children’s book, “The Adventures of Laura the Ladybug,” teaching elementary aged students and young audiences of the important impact of green spaces on urban air quality. The cover is featured to the right, and the synopsis is: “Follow Laura as she learns how bad air and good air change around Cologne. She wants to know how trees help keep the air clean. With Christoph the Oak Tree and Thelma the Truck helping her figure it out, Laura is excited to learn all about Cologne!”

For adult audiences, particularly voting citizens of Cologne, we thoroughly analyzed the Cologne Government’s Urban Development Plan 2.0, considering the five principles and corresponding goals across social, economic, and environmental sectors. From these findings, we provided interpretations of the next decade of environmental targets, and determined the connection to our data analysis and findings.
In turn, our recommendations for NO2 reductions for improving national and regional air quality standards through active citizen participation through voting and public awareness of current development plans, starting at a young age. Further, preventative routines and behaviors at the individual and household level, such as decreasing personal transportation trips by cars and trucks, and opting for public transportation, cycling, and walking when possible. Finally, supporting the growth and development of green spaces such as Finkens Garten at Rodenkirchen is an essential component of improving air quality and quality of life in Cologne.
Takeaway
This project was a great blend of scientific research and UI design. I learned a lot about the different technical tools we used, particularly R and Posit Cloud, which helped us understand the many factors influencing air quality in our chosen region. Beyond technical skills, I also gained experience formatting dense, research-heavy data into an engaging and approachable format. While we initially planned to target local policymakers, we realized a more impactful audience would be everyday members of the Cologne community. In response, we developed a website and children’s book to share our findings in accessible ways that could still inspire change. We shared our work with several community members and sent it to local government officials, though we have not received a response yet. Regardless, the project taught me a lot about digesting complex research and designing UI for important data-driven insights. I am proud of how our final product turned out, and I had a lot of fun voicing Christoph the Oak Tree for our audiobook.
